Quicken Product Highlights May 2021
Customizing your investment views (Windows Product Highlight)
The Investing tab has multiple views that you can choose when tracking and analyzing your portfolio. These views are customizable, giving you even greater flexibility in how you look at your investments.
Portfolio View
You can use the Show menu to choose from a number of options such as Value, Recent Performance, Historical Performance, Fundamentals, Quotes, and other options. You can use Group by to choose how your investments are displayed on the page, and you can use the As of date to set the date you want to view investments.
In the Portfolio view, you can use the Customize button to set what Columns you display, what Accounts you can view, and what Securities you include or exclude. You can use Customize to change an existing view or you can create and name a brand new view.

You can also adjust the size of columns by selecting the line between columns and dragging left or right to make the column larger or smaller. This applies to columns throughout the different investment views.
You can further adjust the Portfolio view by selecting Options. Using Options, you can set your Portfolio preferences and determine whether to Show closed lots and Show cents in amounts.
Performance View

The performance view is focused on presenting charts and other information about how your investments are doing. Because it is more focused than the Portfolio view, there aren’t as many customizations to be made, but you can still determine what accounts to include, what securities to include, and the time frame you want to view. You can also use the gear icon in your graphs to expand the size of the graph and to look at the reports that show the data behind the graph.
Allocations View
The Allocations view is designed to show you where you are investing your money by asset class, such as in bonds, large and small-cap stocks, cash, and other investments. Your primary ways to customize the view are to choose the accounts. You can also filter your securities list to view just the securities you want to review.
Dashboard View

The Dashboard gives you four at-a-glance views of your investments: Total Value, Portfolio by Security, Top Movers, and Value over time. You can use the top selectors to determine what accounts and securities to include.
Understanding the portfolio view for investing (Mac Product Highlight)
When you select an investing account, Quicken provides two ways to view your account, Portfolio and Transactions. Transactions will provide you with a list of individual purchases, sales, and other transactions that affect your investment balance. The Portfolio view is an overview of your total portfolio performance.
The Portfolio view lets you see every account and you are tracking through Quicken. You can view a combined portfolio for all your investment accounts by clicking Investing in the sidebar. This allows you to see a single, unified portfolio view across all your brokerage accounts. You can select each level this way, for example selecting Tax deferred to see just your retirement portfolio. Of course, you can also select an individual investment account from the sidebar to see just the holdings in that single account.

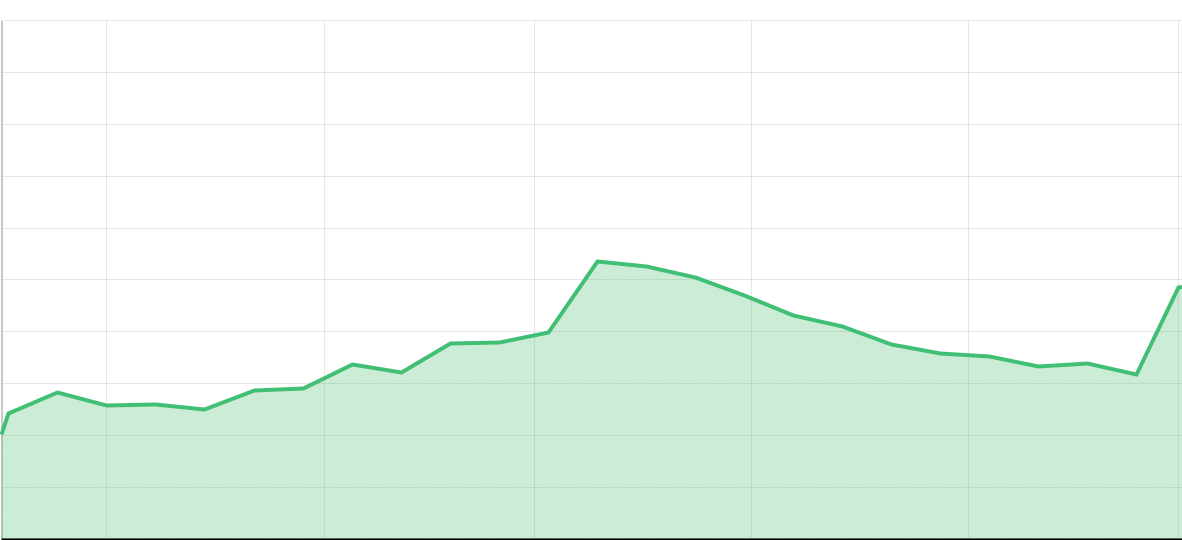
You can track your portfolio’s performance over time by selecting a time frame from the Year to Date (YTD) all the way to the past ten years or more depending on when you made your investments.

If you want to look at your portfolio up through a date, you can use the Price and Holdings as of data field. This will let you know how your holdings were doing as of a specific date. When you do this, you may notice that the securities listed in your Portfolio graph change. This will happen if you have bought or sold securities after the date you choose for Price and Holdings as of.
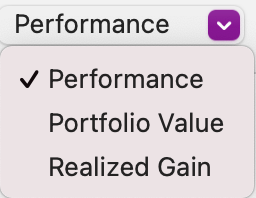
You have three ways you can view your portfolio. You can choose from Portfolio Value, Performance, or Realized Gain. Portfolio Value is designed to let you know the current and past worth of your investments. Performance is focused on how your investments are performing based on industry-standard metrics such as Internal Rate of Return (IRR) or Return on Investment (ROI). Realized Gain is for looking at any sales you made during the time period you’ve chosen.
Your other big option for customizing your view is the way you group your investments. There are several options to choose from including Group by Security, Group by Asset class (such as Large Cap Stock and Small Cap Stock), and Group by Type (such as Stocks and Bonds).
You can adjust your view in many ways, such as adding or removing columns. To Configure Columns, select the three-column icon to the right above the column headings. You will see a list of Available columns and Displayed columns. Use drag-and-drop to move items from Available to Displayed or from Displayed to Available. You can also drag items to move them up or down in the column order.
You can also adjust your graph, making it larger, smaller, or eliminating it from the view entirely. Just click and drag the line under the chart.
Quicken has made the material on this blog available for informational purposes only. Use of this website constitutes agreement to our Terms of Use and Privacy Policy. Quicken does not offer advisory or brokerage services, does not recommend the purchase or sale of any particular securities or other investments, and does not offer tax advice. For any such advice, please consult a professional.


